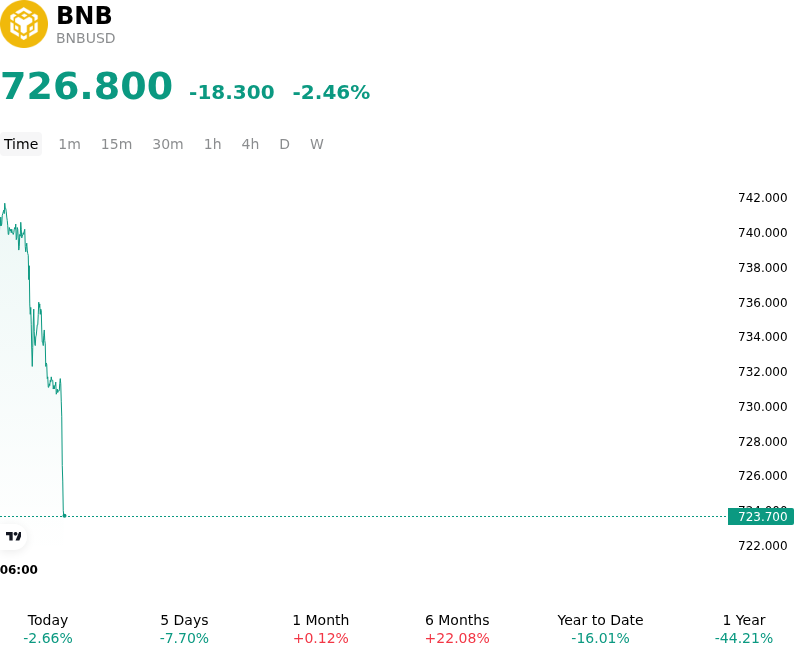
BNB (BNBUSD) is down 2.46% at Oct 13 20:10(ET), now at $726.8, with a 7-day down of 6.54%.
What is driving BNB (BNBUSD)’s stock price down today?
The recent downward price action in BNB reflects a broader risk-off consolidation across major digital assets, driven by tightening financial conditions and shifting macroeconomic expectations. Persistent uncertainty surrounding the Federal Reserve's monetary policy path, coupled with elevated treasury yields, has led institutional investors to adopt a more defensive stance across high-market-cap cryptocurrencies. As capital flows cooled following strong late-third-quarter momentum, major smart contract platforms experienced a synchronized retreat as market participants reduced risk exposure ahead of key macroeconomic data releases.
From a market structure perspective, BNB encountered technical overhead resistance after testing key upside benchmarks, triggering systematic profit-taking among short-term holders. The pullback was amplified by leverage reduction in the digital asset derivatives market, where localized long liquidations forced a rapid reset in perpetual futures positioning. Funding rates across major trading venues compressed, pointing to aggressive long unwinding rather than sustained institutional short building. Furthermore, spot market demand temporarily softened as market participants digested ongoing regulatory compliance scrutiny and evolving licensing dynamics across key global regions, dampening immediate speculative appetite.
Despite the short-term market contraction, the decline represents a technical leverage reset rather than a fundamental breakdown in ecosystem activity. Core on-chain metrics across the BNB Chain, including daily active addresses, transaction throughput, and gas utilization, remain structural anchors, supported by continuous network upgrades and programmatic token supply contraction through the automated burn mechanism. Institutional strategists continue to monitor global liquidity conditions, derivatives open interest, and regulatory updates to evaluate broader market trajectory and capital deployment dynamics.
Technical Analysis of BNB (BNBUSD)
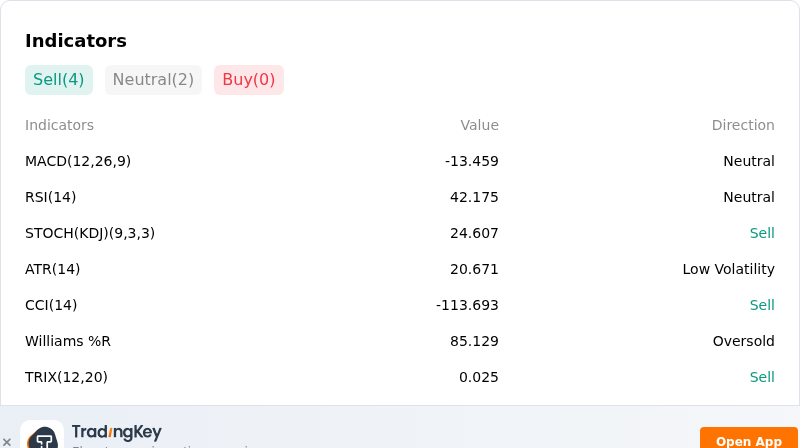
Technically, BNB (BNBUSD) shows a MACD (12,26,9) value of -13.459, indicating a neutral signal. The RSI at 42.175 suggests neutral condition and the Williams %R at 85.129 suggests oversold condition. Please monitor closely.
More details about BNB (BNBUSD)
Recent Events and Risks:
- Exchange Regulatory Scrutiny and Sanctions Oversight: Recent reports detailing alleged sanctions-evasion liquidity flows through Binance have escalated global compliance scrutiny, maintaining a persistent regulatory discount and headline risk on BNB.
- Derivatives Leverage Unwinds and Long Liquidations: Intraday broad-market pullbacks triggered multi-million-dollar long-position liquidations across major derivatives exchanges, accelerating downward momentum for BNB toward critical technical support levels.
- Ecosystem Security Breaches and On-Chain Sell Pressure: Smart contract exploits within BNB Chain decentralized finance protocols, such as the $12.5 million 79thVault breach, caused direct on-chain token dumps that weighed on market sentiment.
- Concentrated Whale Transfers to Centralized Exchanges: On-chain analytics recorded large wallet holders depositing thousands of BNB onto exchanges while sitting on floating losses, heightening fears of spot market dumping and localized liquidity absorption.
Find out more